[vc_row][vc_column][vc_empty_space][/vc_column][/vc_row][vc_row][vc_column][vc_column_text]
CUBED Insight gives you immediate access to reports that inform instruction
[/vc_column_text][/vc_column][/vc_row][vc_section][vc_row][vc_column][vc_column_text]
UNIVERSAL SCREENING REPORTS
Get snapshot view of your students with ring charts

View fall, winter, or spring benchmark universal screening results on the main reports page. Ring charts show the percentage of students at high risk, moderate risk, or low risk. Insight automatically determines risk based on benchmark expectations derived from the Common Core State Standards and normative research. The benchmarks can be found in the CUBED manual. Reports can be filtered to display district-wide, school-wide, classroom, or caseload results. Information for special groups of students can be displayed (e.g., a high intensity reading group). Ring charts provide a quick overview of students’ current performance across all of the areas that are assessed.[/vc_column_text][/vc_column][/vc_row][/vc_section][vc_section full_width=”stretch_row” css=”.vc_custom_1530912939586{background-color: #def3f4 !important;}”][vc_row][vc_column][vc_column_text]
See who is at risk and what areas they need to be taught

Quickly view the benchmark results for all assessment areas for each student in his or her group. Data can be further filtered to display any combination of risk level (low, moderate, high) across the assessments. For example, an educator can constrain the report to show only those students at moderate or high risk for language comprehension and reading comprehension. It is also possible to only view students who are at high risk on phonemic awareness. Filtering can take place across all of the assessment domains. Thus, a subset of students can be identified as needing specific instruction quickly and efficiently.[/vc_column_text][/vc_column][/vc_row][/vc_section][vc_section full_width=”stretch_row” css=”.vc_custom_1530913246289{background-color: #e7f4d0 !important;}”][vc_row][vc_column][vc_column_text]
View individual student benchmark and progress monitoring results
 View a student’s current benchmark performance (i.e. status) to see whether the student is at high, moderate, or low risk for each of the assessments. By clicking the Progress tab, you can see the student’s performance over time. A trend line indicates the student’s progress, which is green if he/she is on track to meet the end of year benchmark assessments or red if he/she is not on track. Using the progress monitoring graphs, you can quickly determine whether a student is projected to meet the end of year expectations, and make adjustments to intervention accordingly.[/vc_column_text][/vc_column][/vc_row][/vc_section][vc_section full_width=”stretch_row” css=”.vc_custom_1530913350952{background-color: #f3f3f3 !important;}”][vc_row][vc_column][vc_column_text]
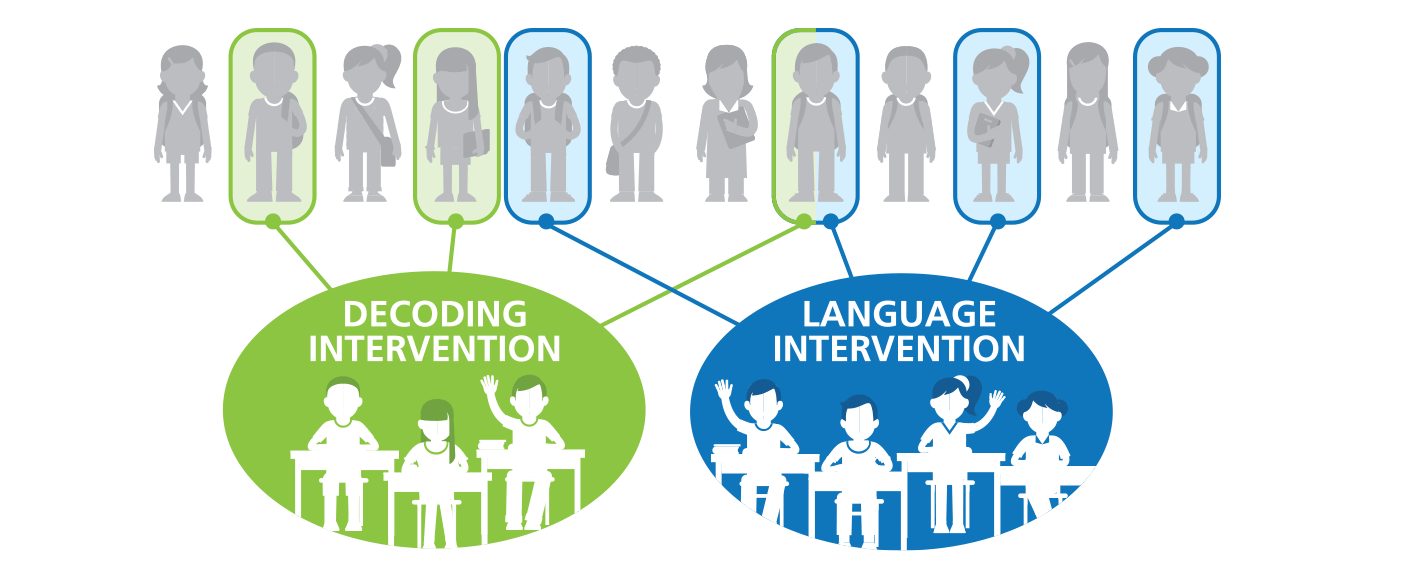
Group students according to similar needs
 To make it even easier, Insight will help inform intervention! The reporting system can instantly sort students according to similar needs. All students, even those at benchmark, can be sorted and viewed so you can easily group students for interventions for decoding and language (i.e., comprehension). Insight also helps you know what to target in interventions. For example, it will tell you which students need to work on the basic story grammar elements or advanced story grammar, language complexity, or vocabulary. For decoding, Insight will inform you which students need targeted instruction for phonemic awareness, letters and letter sounds, or decoding.[/vc_column_text][/vc_column][/vc_row][/vc_section]
